Reports and Deliverables for Gulf Coast Prairie LCC SLAMM Gap Analysis Project
Quick Links
Final Project Report (minor update 3/30/16)
Final Model Raster Output with Associated Metadata
Focal Species Analysis - Geospatial data
Focal Species Analysis - Excel spreadsheet of metrics (updated 6/12/15)
All SLAMM inputs are available on request.
The SLAMM models that existed prior to this project can be downloaded under Task 2.
SLAMM models of gap areas and updated existing areas run for this project can be obtained by contacting WPC.
Please email apolaczyk@warrenpinnacle.com
Full Gulf Rasters
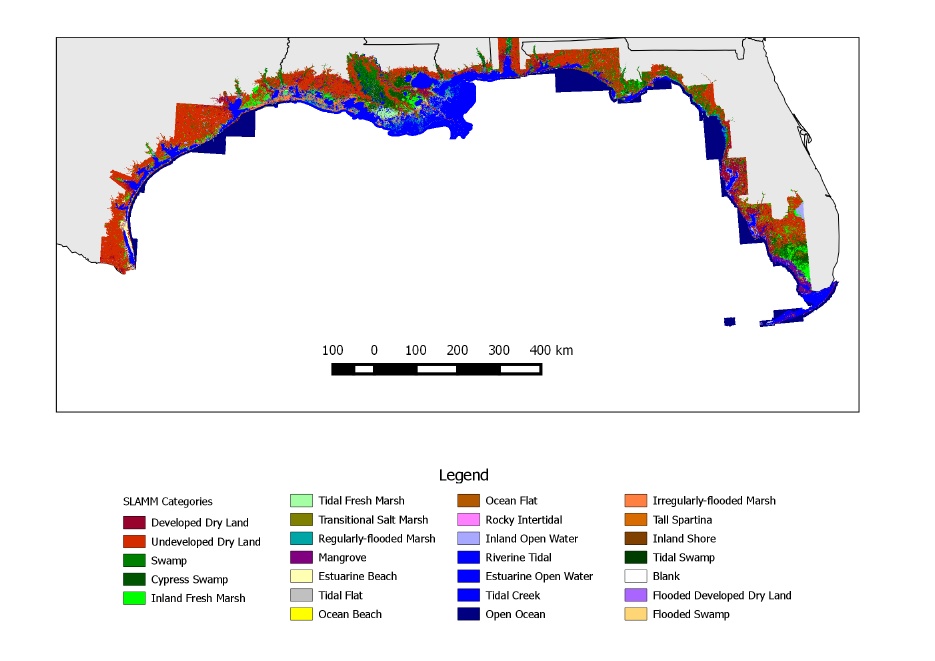
SLAMM outputs were combined to create raster layers of projections for the entire Gulf of Mexico.
The individual rasters are quite large (~ 32GB each) while the zipped directories for download below are ~ 330MB.
A README document is available to explain the file naming conventions used.
A legend provides the wetland type associated witheach numeric SLAMM category code.
Raster output by SLR scenario:
Task 1-- Data Management Plan
Task 2-- Database Compilation
README file (PDF)
GCP SLAMM Projections (PDF)
GIS Repository (shape, database and projection files) of previously run SLAMM projects (2.1 MB)
Exisiting Gulf of Mexico SLAMM Input Parameters (*.xslx)(1 MB)
Gulf of Mexico SLAMM Application Reports (391 MB)
Gulf of Mexico SLAMM Project Repository (2 GB)
SLAMM Color Legend (.txt)
Task 3-- Input Parameter Collection
Task 3 README file (PDF)
Spatial Database of Input Parameters (zip file, 2.4 MB)
Task 4-- Collection and preparation of spatial input data
Task 5-- Mechanistic Accretion Model Development
Technical memo describing the final accretion model(s) to be applied
Task 6-- Seamless SLAMM application to entire US Gulf of Mexico Coast
Task 7-- Analysis of low-quality elevation data effects
The analysis of low-quality elevation data effects is written up in the Final Report
Task 8-- Apply results to characterize the vulnerability of selected focal species
Excel spreadsheet of metrics (updated 6/12/15)
Task 9-- Final Report and Technology Transfer
Rasters with associated metadata files
(click the picture for a higher resolution image)
.

